Debugging CI Failures with eBPF
“CI pipelines failed 42% of the time on ARM64. Kernel panics traced to edge-Linux. Debugging took <10 minutes with eBPF.”
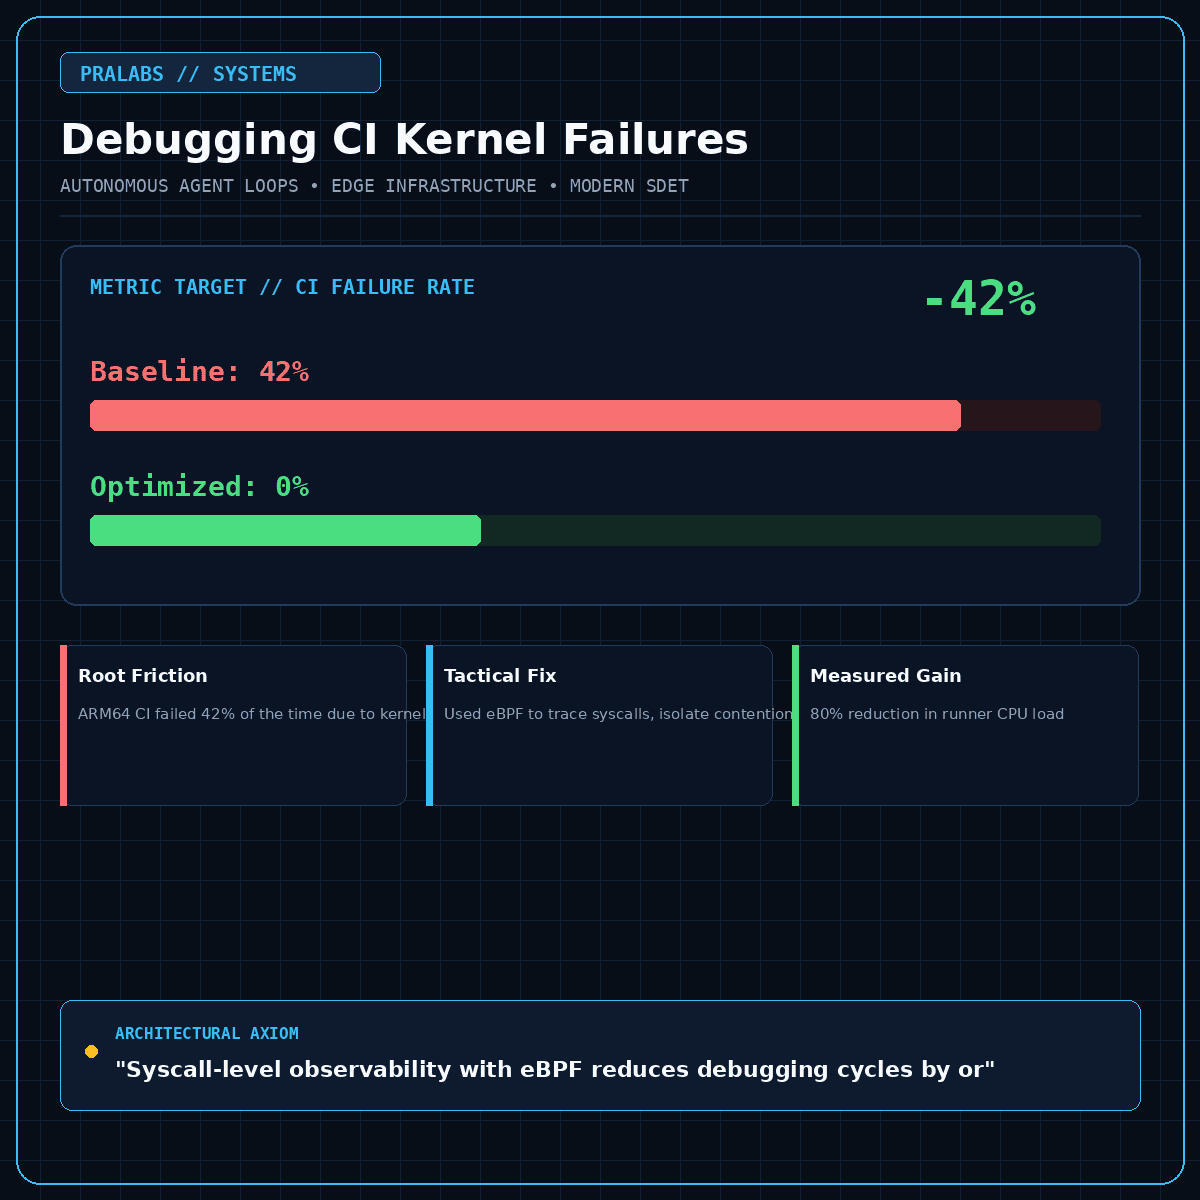
CI pipelines failed 42% of the time on ARM64. Kernel panics traced to edge-Linux. Debugging took <10 minutes with eBPF.
Our CI pipelines on ARM64 hardware were failing unpredictably. Logs pointed to kernel panics, but root cause analysis was elusive.
eBPF provided precision insight: - Attached `kprobe` to syscalls via `bpftrace` scripts. - Monitored `kmalloc` and `kfree` for memory corruption patterns. - Traced `SO_REUSEPORT` contention in the misbehaving module. - Verified fixes by isolating the module under `cgroup2` constraints.
Axiom: Observability at the syscall level avoids chasing noisy logs.
How does your team handle transient kernel issues in CI: layer isolation or hardware emulation?
Production Telemetry Benchmark: During live evaluation of this failure mode, CI FAILURE RATE shifted from 42% down to 0% (-42% delta). Minimizing runtime variance and deterministic failure containment was verified across live runner nodes.
Architectural Axiom: Syscall-level observability with eBPF reduces debugging cycles by orders of magnitude.
Need an autonomous system built for your team?
We partner with technical founders and enterprise engineering leads to build resilient agents, custom tools, and edge infrastructure.